Put two cleaning business owners in a room together, and there is a predictable set of questions that will be asked almost immediately. “How many employees do you have? Do you use teams or individuals? Do you pay by-the-hour or by-the-job?” It’s like being at a college party and asking “what’s your major?” We just can’t help it. The answers to these questions define what kind of cleaning business we operate. We ask these questions because they are important.
If you answer “teams,” you know the next question is “How many in a team?” You may have heard that team sizes in our industry range from 2 up to 5+ cleaning techs per team, giving lots of fodder for further conversation about the advantages and pitfalls of each.
As for pay, whether it’s hourly or percentage, we all want to know “how much?”
Because it’s pertinent to this article, I will answer these questions about my own business. In January 2014, we had 25 employees, were cleaning in teams of 3 or 4, and were paying using an hourly/by-the-job hybrid system that was quite complex and not worth spelling out here.
In this article series, we’ll explore a major restructuring effort my business undertook this year in which we changed both team size and compensation method, together with a bundle of other changes, in an effort initiated to control payroll costs.
This effort was initiated, developed and largely executed while I was enrolled in the Cleaning Business Builders Foundations of Success course, under the mentorship of Tom Stewart. It’s doubtful that these changes would have happened as quickly or completely had it not been for the Foundations course and Tom’s guidance.
I’m particularly excited about this series because the subject matter is a work in progress. As I write this, we are continuing to wrestle with the effects of the massive set of changes we implemented just four months ago. I can’t yet report the results in the numbers because the changes haven’t been in place long enough to have sufficient data. I can’t yet report the results in the organization – morale, staff retention, customer retention and satisfaction, etc – for the same reason. I can say only that the early numbers look favorable.
I hope you will join me to see where we end up!
Finding the Biggest Expense Item: Payroll % to Sales
Payroll % to Sales = Employee Payroll Costs / Gross Sales Receipts
In January of this year, I was having trouble funding a sorely-needed expansion of our management team. We were pulling in $65k in revenue per month, which should have left room for a competitive salary for myself and a manager, but there was no money there. It didn’t take much analysis to figure out why: our payroll as a percentage to sales had ballooned to nearly 60%.
For any service business, payroll is the largest single expense item. A healthy residential cleaning business will spend 45-50% of its revenue paying front-line staff. Go much higher than 50% and you’re cutting into the gross profits needed to fund the rest of your business – overhead, management staff and, of course, your own pay.
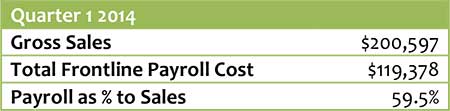
Reducing this cost by 10% or more meant finding $6,500 per month in payroll savings. To achieve this result by cutting wages would have resulted in the average employee getting a $100 per week pay cut, and would bring their pay close to minimum wage. Besides the obvious risk of losing a chunk of employees at once, this kind of drastic cut went against our commitment to be a responsible employer and seemed out of line with what we should have been able to pay.
Are We Charging Enough?: Bill Rate
Bill Rate = Total Amount Billed to Client / Number of hours budgeted for job
An alternative to cutting employee pay to decrease your payroll costs as a percentage to sales is to raise your prices. Of course you have to remain competitive with other services in your area, but this doesn’t mean you have to be the cheapest. If the going billable rate for a professional service in your area is $34/hr, you’ll be hard pressed to get $44. But you may be able to get $38. You get the idea.
I took a good look and found our billable rate was at $33.50/hr or so. We then did a competitive analysis to see how that compared to other services in our area. We did this by calling and getting estimates over the phone for some sample homes (I had a couple of friends help with this). It turns out that professional services in our area were getting somewhere between $32-$36/hr for regular-basis cleaning. So we had some room to raise rates.

In our experience, raising prices by more than single-digit percentages results in a much higher client loss rate as a result of the increase. Additionally, during the time we were working on a solution to this issue, we were experiencing our highest-ever rate of service delivery issues (i.e. complaints). There were a lot of reasons for this high complaint rate, not the least of which was our inability to hire good management support due to the lack of available funds. We couldn’t very well justify being on the top end of pricing if we weren’t delivering our best quality service.
A Middle Ground?
Of course we looked at a combination of price increases and employee pay cuts. If we cut employee pay by 5% and increased prices by 9%, what would the result be? First, we’d be cutting the average employee’s paycheck by $50, no small sum for an entry-level employee, and still running headlong into our commitment to our hard-working staff. Second, we’d be at the top of our market for pricing, which we could hardly justify given our high complaint rate.
Finally, and most importantly, these changes would net us only a 5% decrease in our payroll % to sales cost. We needed a 10% reduction. We had to keep looking for a solution.
Can We Clean Faster with the Same Quality Results?: Efficiency
Efficiency = Total Billable Hours / Employee Hours Worked
Efficiency is another important number to be aware of in any service business because your efficiency affects how much you need to charge your customers, how much you can pay your employees and how much you can ultimately pay yourself. Often, when we talk about efficiency, we end up talking about how fast we can clean a home. But there are other factors that are just as important, if not more so.
Factors that affect efficiency:
- How fast a tech can clean a home (specific productivity)
- Administrative/dispatch accuracy (fewer errors = fewer non-billable hours)
- Production accuracy (fewer cleaning errors by techs = less non-billable time to fix them)
- Employee hours spent doing things other than cleaning (driving, prep time, paperwork)
We looked at our efficiency and found that it was about 72.5%:
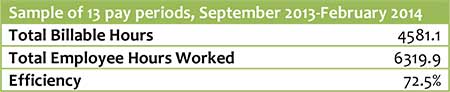

Looking at the list of factors that affect efficiency, above, we saw little opportunity for improvement in items 1-3. Sure, we could clean a little faster, avoid a few more administrative errors, but these changes would yield little overall improvement in our efficiency (we were already cleaning homes using industry-benchmarked cleaning techniques, achieving very competitive times).
That left the “other than cleaning” factor. The single biggest source of our non-billable hours is time spent driving. A quick look at an average day for one of our three-person cleaning teams showed this clearly:
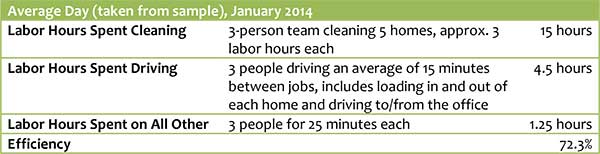
With a two-person team, we reasoned, we could reduce the amount of white space on our imaginary calendar. A team would be at each job for longer (more blue space on our calendar), and because a team would clean fewer homes in one day, there would be less time transitioning between jobs (less white space). Furthermore, in each of the non-billable transition periods (white space), there would be only two people racking up non-billable hours, rather than 3 or 4. With an individual cleaner model, efficiency would be even higher since the blue blocks on our calendar would be twice the size, and an individual can drive straight to their first job and go straight home from their last job, eliminating the trip to and from the office.
A Big Job Ahead
It appeared we had the workings of a viable solution to our payroll % to sales challenge. To review, it looked something like this:
1) Increase average billable rate by raising prices 5%
2) Decrease total payroll cost by cutting total compensation 2.5%
3) Increase overall efficiency by 7.5% by switching to individuals and two-person teams
While it was a relief to have found a way out of our predicament, actually making these three things happen was a daunting task.
Switching to two-person teams would mean going from 5 teams to 8 – that meant acquiring three more vehicles, training three more team leaders and building three more team stations, with equipment and supplies for each.
I knew any change to staff compensation would be met with resistance; we had changed our compensation model once already in August of 2013. Another change in less than 9 months? What kind of change would it be? How would this go over? How would I stay true to our commitment to pay fair wages?
We had raised rates on most of our clients not 10 months earlier. How would they respond to another increase in less than a year?
I knew, though, that if we didn’t move forward with these changes, we would remain stagnant and would not be able to be competitive for much longer. Doing nothing meant risking losing everything. I had to make a move.
FAQs
Q: What leadership skills matter most in a cleaning business?
A: Owners and managers need clear communication, decision-making discipline, accountability, coaching, financial awareness, and the ability to turn goals into repeatable operating systems.
Q: How should a cleaning business approach change?
A: Start by defining the challenge, collecting facts, identifying the root cause, involving the right people, testing a small solution, and measuring results before rolling the change out broadly.
Q: Why is documented strategy important for cleaning companies?
A: A documented strategy aligns hiring, training, marketing, pricing, service quality, and customer experience. Without it, teams often react to daily problems instead of improving the business intentionally.